The DataModelViewer class provides a visualization tool for data model types. More...
#include <datamodelviewer.h>
Public Slots | |
| void | increaseSamplingDensity () |
| void | hideParameterGUI (bool hide=true) |
| void | reduceSamplingDensity () |
| void | setLabelX (const QString &label) |
| void | setLabelY (const QString &label) |
| void | setNumberOfSamples (int nbSamples) |
| void | setSamplingRange (float from, float to) |
| void | toggleLogY () |
Public Member Functions | |
| DataModelViewer (QWidget *parent=nullptr) | |
| ~DataModelViewer () | |
| LineSeriesView * | dataViewValues () const |
| IntervalSeriesView * | dataViewBinIntegrals () const |
| void | setData (std::shared_ptr< AbstractDataModel > model) |
| Sets the data model visualized by this instance to model. More... | |
| void | setData (const AbstractDataModel &model) |
| Sets the data model visualized by this instance to model. More... | |
Static Public Member Functions | |
| static void | plot (std::shared_ptr< AbstractDataModel > model, const QString &labelX="x", const QString &labelY="y") |
| Creates a DataModelViewer for model and shows the window. More... | |
| static void | plot (const AbstractDataModel &model, const QString &labelX="x", const QString &labelY="y") |
| Creates a DataModelViewer for model and shows the window. More... | |
Protected Member Functions | |
| void | keyPressEvent (QKeyEvent *event) override |
Private Slots | |
| void | updatePlot () |
Private Member Functions | |
| void | setModelParameter (QVariant parameter) |
Private Attributes | |
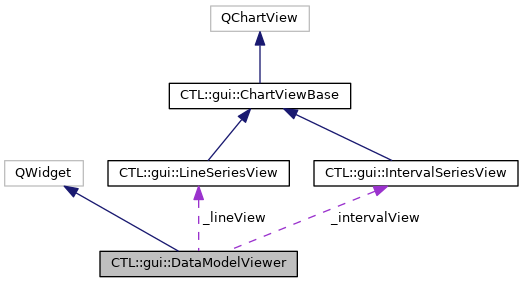
| LineSeriesView * | _lineView |
| IntervalSeriesView * | _intervalView |
| Ui::DataModelViewer * | ui |
| std::unique_ptr< AbstractDataModel > | _model |
Detailed Description
The DataModelViewer class provides a visualization tool for data model types.
This class can be used to visualize data models of subclasses of AbstractDataModel and AbstractIntegrableDataModel. For convenience, the plot() method can be used to achieve a one-line solution, creating a widget that will be destroyed once it is closed by the user.
Data is visualized as a line plot (using LineSeriesView). In case of an integrable model, bin integral data can also be visualized as a bar plot (using IntervalSeriesView). View modes can be toggled using the GUI. The number of values that are sampled from the model (and visualized in the viewport) can be adjusted via the GUI or using the corresponding slots setNumberOfSamples(), increaseSamplingDensity(), and reduceSamplingDensity(). Axis labels (identical for both plot types) can be specified using setLabelX() and setLabelY() or by passing the labels as arguments when using the plot() method, respectively. Linear/logarithmic y-axis visualization can be toggled using toggleLogY() as well as via the GUI.
In case the visualized data model has parameters, these can be adjusted directly within this viewer's GUI. The parameter GUI can be hidden using hideParamterGUI(), if desired. It becomes hidden automatically in case the model does not have any parameters. Modifying model parameters from outside the viewer will not automatically update the plot. If such a setting is required, use updatePlot() to enforce redrawing of the plot. (Note that this will not update the entries in the parameter GUI.)
The following IO operations are supported by this class:
- Zooming:
- Hold left mouse button + drag rectangle to zoom into that particular section of the plot.
- Right click to zoom out.
- Double-click left to request automatic zooming (ie. min/max).
- Save to image:
- Press CRTL + S to open a dialog for saving the current figure to a file.
The following example shows how to visualize a data model with the DataModelViewer class:
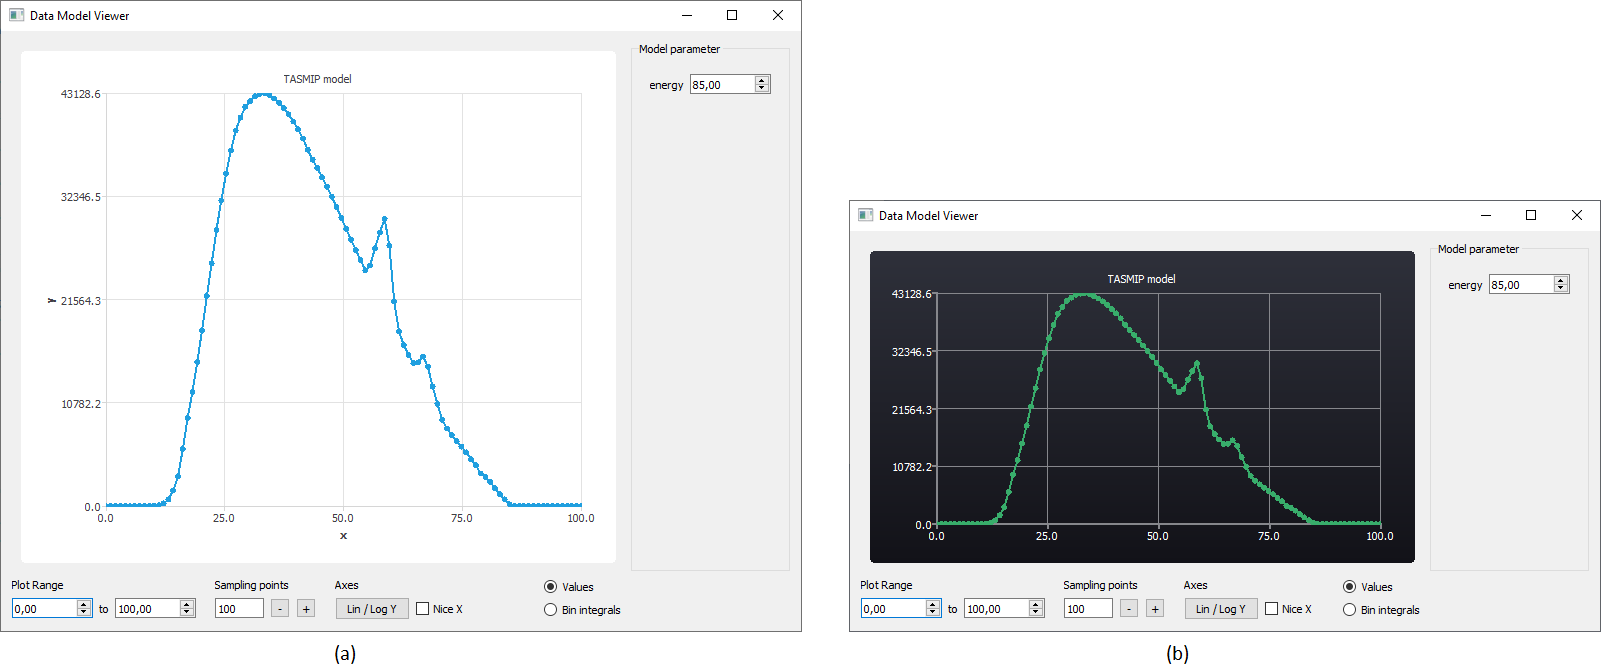
As can be seen from the example, the property-based version allows accessing the viewports, and thereby, grants control over their specific settings (such as visual appearance or axis ranges). The viewports are accessible via dataViewValues() and dataViewBinIntegrals() for the line and bar plot view, respectively.
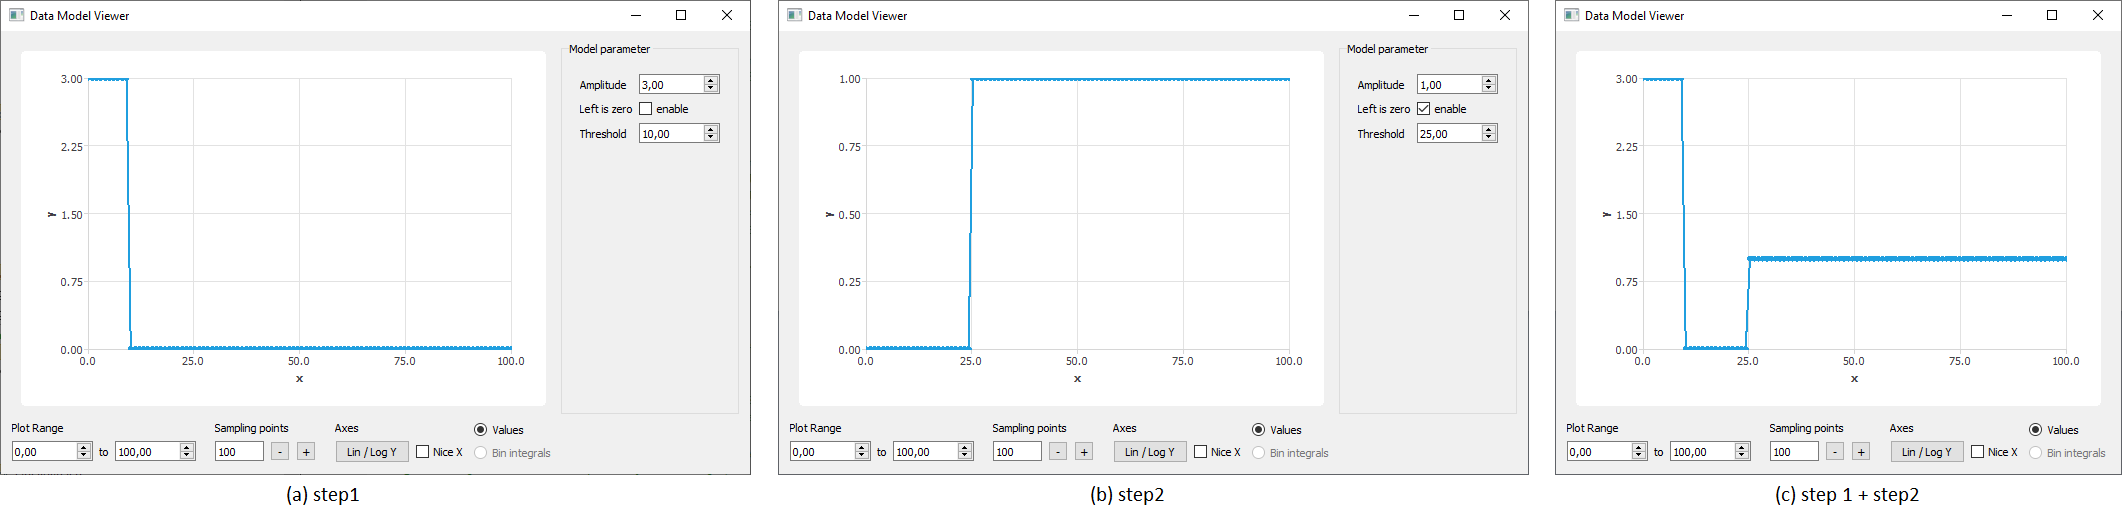
The DataModelViewer can also be used conveniently to inspect compositions of multiple models. The following example illustrates that for a sum of two step function models:
Constructor & Destructor Documentation
◆ DataModelViewer()
|
explicit |
Creates a DataModelViewer and sets its parent to parent.
◆ ~DataModelViewer()
| CTL::gui::DataModelViewer::~DataModelViewer | ( | ) |
Deletes this instance.
Member Function Documentation
◆ dataViewBinIntegrals()
| IntervalSeriesView * CTL::gui::DataModelViewer::dataViewBinIntegrals | ( | ) | const |
Returns the viewport for displaying the bin integral data in this instance. Use this to adjust its specific settings if required.
Example: setting a dark theme for the bin integral chart
- See also
- IntervalSeriesView.
◆ dataViewValues()
| LineSeriesView * CTL::gui::DataModelViewer::dataViewValues | ( | ) | const |
Returns the viewport for displaying the line series data in this instance. Use this to adjust its specific settings if required.
Example: setting a specific axis range for the line series view and changing the chart title
- See also
- LineSeriesView.
◆ hideParameterGUI
|
slot |
Hides the model parameter GUI element if hide = true and shows it otherwise.
◆ increaseSamplingDensity
|
slot |
Increases the number of sampling points by 25% of their current value.
◆ plot() [1/2]
|
static |
Creates a DataModelViewer for model and shows the window.
Note that this instance takes a copy of model through its clone() method. model must not be nullptr; throws an std::runtime_error otherwise.
Labels of the axes can be specified by labelX and labelY. If left empty, default axis labels are "x" and "y".
Depending on whether or not model is integrable (see AbstractIntegrableDataModel), the widget also offers the option to visualize bin integrals.
The widget will be deleted automatically if the window is closed.
Example:
◆ plot() [2/2]
|
static |
Creates a DataModelViewer for model and shows the window.
Note that this instance takes a copy of model through its clone() method.
Labels of the axes can be specified by labelX and labelY. If left empty, default axis labels are "x" and "y".
Depending on whether or not model is integrable (see AbstractIntegrableDataModel), the widget also offers the option to visualize bin integrals.
The widget will be deleted automatically if the window is closed.
Example:
◆ reduceSamplingDensity
|
slot |
Reduces the number of sampling points to 80% of their current value.
◆ setData() [1/2]
| void CTL::gui::DataModelViewer::setData | ( | std::shared_ptr< AbstractDataModel > | model | ) |
Sets the data model visualized by this instance to model.
Note that this will clone the model, such that the viewer instance will own a copy of model. model must not be nullptr; throws an std::runtime_error otherwise.
◆ setData() [2/2]
| void CTL::gui::DataModelViewer::setData | ( | const AbstractDataModel & | model | ) |
Sets the data model visualized by this instance to model.
Note that this will clone the model, such that the viewer instance will own a copy of model.
◆ setLabelX
|
slot |
Sets the label of the x-axis of both plot types to label.
◆ setLabelY
|
slot |
Sets the label of the y-axis of both plot types to label.
◆ setNumberOfSamples
|
slot |
Sets the number of sampling points to nbSamples.
◆ setSamplingRange
|
slot |
Sets the range within which the model is sampled to [from, to].
◆ toggleLogY
|
slot |
Toggles between linear and logarithmic y-axis display.
◆ updatePlot
|
privateslot |
Updates the current plot. This will readout all UI elements for information on sampling and performs a new sampling of the values from the model.
This is called automatically when necessary.
The documentation for this class was generated from the following files:
- modules/src/gui/widgets/datamodelviewer.h
- modules/src/gui/widgets/datamodelviewer.cpp