The ProjectionViewer class provides a tool for visualization of ProjectionData. More...
#include <projectionviewer.h>
Public Slots | |
| void | autoResize () |
| void | setAutoMouseWindowScaling () |
| void | showView (int view) |
Public Member Functions | |
| ProjectionViewer (QWidget *parent=nullptr) | |
| ProjectionViewer (ProjectionData projections, QWidget *parent=nullptr) | |
| ~ProjectionViewer () | |
| const ProjectionData & | data () const |
| Chunk2DView * | dataView () const |
| void | setData (ProjectionData projections) |
| void | setModuleLayout (const ModuleLayout &layout) |
| void | setWindowPresets (QPair< QString, QPair< double, double >> preset1, QPair< QString, QPair< double, double >> preset2) |
| int | currentView () const |
Static Public Member Functions | |
| static void | plot (ProjectionData projections, const ModuleLayout &layout={}) |
Protected Member Functions | |
| void | keyPressEvent (QKeyEvent *event) override |
Private Slots | |
| void | changeView (int requestedChange) |
| void | updateSliderRange () |
| void | updatePixelInfo (int x, int y, float value) |
| void | windowingUpdate () |
Private Attributes | |
| Ui::ProjectionViewer * | ui |
| ProjectionData | _data = ProjectionData(0,0,0) |
| ModuleLayout | _modLayout |
Detailed Description
The ProjectionViewer class provides a tool for visualization of ProjectionData.
This class can be used to visualize ProjectionData objects. For convenience, the plot() method can be used to achieve a one-line solution, creating a widget that will be destroyed once it is closed by the user.
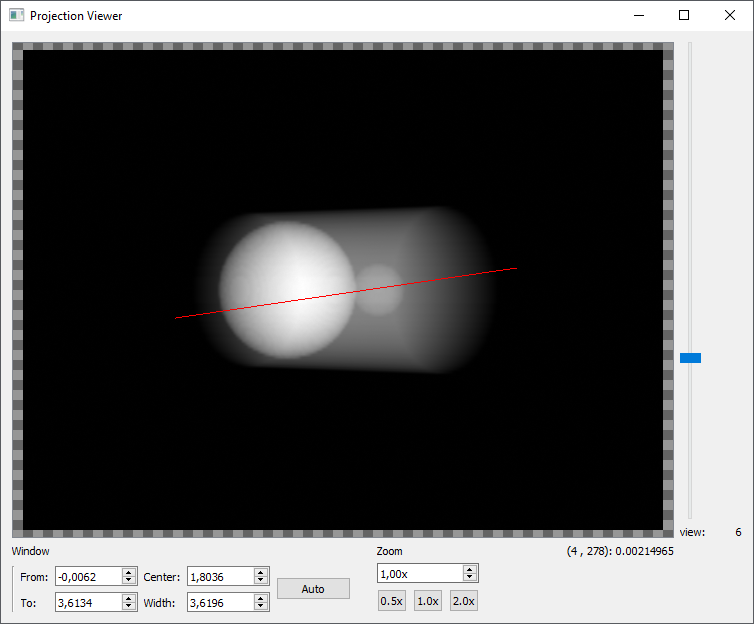
Use the vertical slider to cycle through the projections from individual views. When projection data shall be visualized that contains multiple detector modules, the specific ModuleLayout of the detector configuration can be passed by setModuleLayout() and the projections will be combined accordingly. Without additional specification of a layout, all found modules are assumed to be arranged in a line next to each other in a horizontal manner.
The following IO operations are supported by this widget:
Within the viewport of the current projection:
- Change view:
- Hold SHIFT + scroll mouse wheel to up/down to show next/previous view
- Zooming:
- Hold CTRL + scroll mouse wheel up/down to zoom in/out.
- Data windowing:
- Hold left mouse button + move up/down to raise/lower the center (or level) of the window.
- Hold left mouse button + move left/right to narrow/broaden the width of the window.
- Double-click left to request automatic windowing (ie. min/max-window).
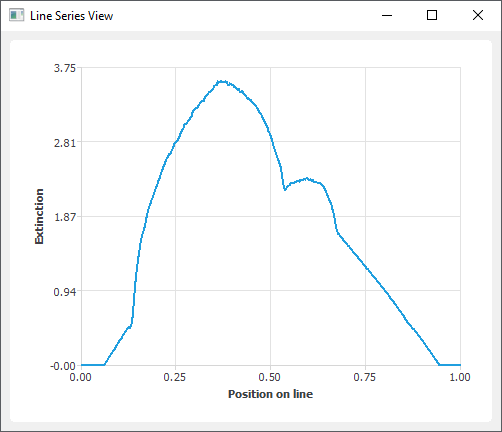
- Plotting a contrast line:
- Hold right mouse button + drag mouse to draw a line.
- Press 'K' button to create a contrast line plot of the current line (requires ctl_gui_charts.pri submodule).
- Press CTRL + C to copy the currently drawn contrast line coordinates to the clipboard
- Press CTRL + V to set a contrast line based on previously copied coordinates from the clipboard. The coordinates can also be copied from another window or widget.
- Read-out live pixel data under cursor:
- Mouse movements: Live pixel data is shown under the bottom right corner of the image.
Anywhere in the widget:
- Save to image:
- Press CTRL + S to open a dialog for saving the current figure to a file.
- Plotting a contrast line:
- Press 'K' button to create a contrast line plot of the current line (requires ctl_gui_charts.pri submodule).
Contrast line plots are opened in separate windows (see LineSeriesView for details on the corresponding widget).
Visualization of the projection image itself is done using the Chunk2DView class. The viewport can be accessed with dataView(), in order to adjust its settings. For mouse gesture windowing, a convenience method setAutoMouseWindowScaling() exists to directly set a sensitivity suited for the current data.
Example:
The property-based version provides more flexibility as it gives access to the full set of methods to configure the ProjectionViewer. In particular, it allows us to configure the viewport showing the individual projections. The following example shows, how we can use this approach to create a visualization that uses a black-red colormap:
Constructor & Destructor Documentation
◆ ProjectionViewer() [1/2]
|
explicit |
Creates a ProjectionViewer object with parent as a parent widget. Note that you need to call show() to display the window.
The static method plot() can be used as a convenience alternative for quick visualization.
◆ ProjectionViewer() [2/2]
| CTL::gui::ProjectionViewer::ProjectionViewer | ( | ProjectionData | projections, |
| QWidget * | parent = nullptr |
||
| ) |
Creates a ProjectionViewer with parent widget parent and sets its data to projections. Note that you need to call show() to display the window.
The static method plot() can be used as a convenience alternative for quick visualization.
◆ ~ProjectionViewer()
| CTL::gui::ProjectionViewer::~ProjectionViewer | ( | ) |
Deletes the object.
Member Function Documentation
◆ autoResize
|
slot |
Requests an automatic resizing of this widget's window size. The window is tried to fit to the size of the shown data, bounded to a maximum size of 1090 x 915 pixels.
◆ currentView()
| int CTL::gui::ProjectionViewer::currentView | ( | ) | const |
Returns the index of the view currently shown in the viewer.
◆ data()
| const ProjectionData & CTL::gui::ProjectionViewer::data | ( | ) | const |
Returns a (constant) reference to the data currently managed by this instance.
◆ dataView()
| Chunk2DView * CTL::gui::ProjectionViewer::dataView | ( | ) | const |
Returns the viewport for displaying the actual projection data. Use this to configure the specific settings of the viewport.
- See also
- Chunk2DView.
◆ plot()
|
static |
Creates a ProjectionViewer for data and shows the window. If a specific ModuleLayout is passed by layout, the data will be combined according to this layout for the purpose of displaying. Otherwise, all modules in data are assumed to be arranged in a line next to each other in a horizontal manner.
Sensitivity of windowing using mouse gestures is adapted automatically to data (see setAutoMouseWindowScaling()).
The widget will be deleted automatically if the window is closed.
◆ setAutoMouseWindowScaling
|
slot |
Convenience method to set automatically determined values for the sensitvity of windowing using mouse gestures.
Same as:
◆ setData()
| void CTL::gui::ProjectionViewer::setData | ( | ProjectionData | projections | ) |
Sets the visualized data to projections. Data is copied, so consider moving if it is no longer required.
Applies a min/max windowing if no specific windowing has been set (ie. the current window is [0,0]).
◆ setModuleLayout()
| void CTL::gui::ProjectionViewer::setModuleLayout | ( | const ModuleLayout & | layout | ) |
Sets the module layout used to combine data from individual detector modules to layout. Data can only be shown on the basis of one combined block of data (Chunk2D).
Calling this method after data has been set will update the visualization with respect to the new layout. Note that the passed layout needs to be compatible with the projection data.
◆ setWindowPresets()
| void CTL::gui::ProjectionViewer::setWindowPresets | ( | QPair< QString, QPair< double, double >> | preset1, |
| QPair< QString, QPair< double, double >> | preset2 | ||
| ) |
Sets the presets of the two preset buttons in the windowing GUI block to preset1 and preset2. Presets must contain the text that shall be shown on the button and the pair of values, specifying start and end of the data window, as a QPair.
The window range will be shown as a tooltip when hovering the cursor over the corresponding button.
Example:
◆ showView
|
slot |
Shows view number view from the currently managed data; view must be a valid index, ie. 0 <= view < data().nbViews().
The documentation for this class was generated from the following files:
- modules/src/gui/widgets/projectionviewer.h
- modules/src/gui/widgets/projectionviewer.cpp