The Chunk2DView class provides basic visualization of Chunk2D data. More...
#include <chunk2dview.h>
Public Slots | |
| void | autoResize () |
| bool | save (const QString &fileName) |
| void | saveDialog () |
| void | setAutoMouseWindowScaling () |
| void | setLivePixelDataEnabled (bool enabled) |
| void | setWindowing (double from, double to) |
| void | setWindowingCenterWidth (double center, double width) |
| void | setWindowingMinMax () |
| void | setZoom (double zoom) |
Signals | |
| void | pixelInfoUnderCursor (int x, int y, float value) |
| void | viewChangeRequested (int requestedChange) |
| void | windowingChanged (double from, double to) |
| void | zoomChanged (double zoom) |
Public Member Functions | |
| Chunk2DView (QWidget *parent=nullptr) | |
| Chunk2DView (Chunk2D< float > data, QWidget *parent=nullptr) | |
| const Chunk2D< float > & | data () const |
| QPixmap | pixmap () const |
| QPair< double, double > | windowingFromTo () const |
| QPair< double, double > | windowingCenterWidth () const |
| double | zoom () const |
| void | setColorTable (const QVector< QRgb > &colorTable) |
| template<typename T > | |
| void | setData (const Chunk2D< T > &data) |
| void | setData (Chunk2D< float > data) |
| void | setMouseWindowingScaling (double centerScale, double widthScale) |
| void | setWheelZoomPerTurn (double zoomPerTurn) |
| QList< QPointF > | contrastLine () const |
| QImage | image (const QSize &renderSize=QSize()) |
| void | setContrastLinePlotLabels (const QString &labelX, const QString &labelY) |
| void | showContrastLinePlot () |
Static Public Member Functions | |
| template<typename T > | |
| static void | plot (const Chunk2D< T > &data, QPair< double, double > windowing=qMakePair(0.0, 0.0), double zoom=1.0) |
| static void | plot (Chunk2D< float > data, QPair< double, double > windowing=qMakePair(0.0, 0.0), double zoom=1.0) |
Private Attributes | |
| QGraphicsScene | _scene |
| QGraphicsPixmapItem * | _imageItem |
| QGraphicsLineItem * | _contrastLineItem |
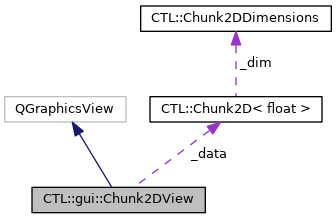
| Chunk2D< float > | _data = Chunk2D<float>(0,0) |
| QVector< QRgb > | _colorTable |
| QPair< double, double > | _window |
| double | _zoom = 1.0 |
| QPointF | _actualZoom = QPointF(1.0, 1.0) |
| QString | _contrLineLabelX = QStringLiteral("Position on line") |
| QString | _contrLineLabelY = QStringLiteral("Value") |
| QPoint | _mouseDragStart |
| QPair< double, double > | _windowDragStartValue |
| QPair< double, double > | _mouseWindowingScaling = {1.0, 1.0} |
| double | _wheelZoomPerTurn = 0.25 |
Detailed Description
The Chunk2DView class provides basic visualization of Chunk2D data.
This class can be used to visualize data stored in a Chunk2D. For convenience, the plot() method can be used to achieve a one-line solution, creating a widget that will be destroyed once it is closed by the user.
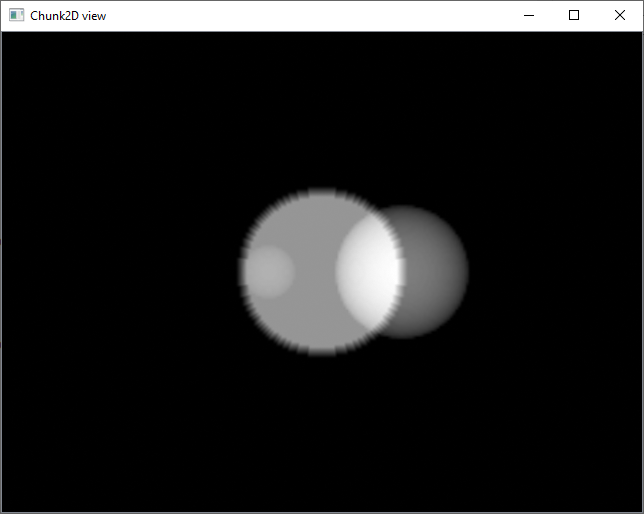
Data will be visualized in 256 discrete value steps - according to the current window - using the colormap specified by setColorTable(). By default, a grayscale colormap is used.
The following IO operations are supported by this class:
- Zooming:
- Hold CTRL + scroll mouse wheel up/down to zoom in/out.
- Data windowing:
- Hold left mouse button + move up/down to raise/lower the center (or level) of the window.
- Hold left mouse button + move left/right to narrow/broaden the width of the window.
- Double-click left to request automatic windowing (ie. min/max-window).
- Plotting a contrast line:
- Hold right mouse button + drag mouse to draw a line.
- Press 'K' button to create a contrast line plot of the current line (requires ctl_gui_charts.pri submodule).
- Press CTRL + C to copy the currently drawn contrast line coordinates to the clipboard
- Press CTRL + V to set a contrast line based on previously copied coordinates from the clipboard. The coordinates can also be copied from another window or widget.
- Save to image:
- Press CTRL + S to open a dialog for saving the current figure to a file.
- Read-out live pixel data under cursor:
- Can be enabled with setLivePixelDataEnabled(true); if enabled, emits a signal with pixel information that can be catched elsewhere.
Sensitivity of mouse gestures (move, wheel) can be controlled with setMouseWindowingScaling() and setWheelZoomPerTurn(). For windowing, a convenience method setAutoMouseWindowScaling() exists to set a sensitivity suited for the current data.
The following example shows how to visualize a single slice from a VoxelVolume data object using the Chunk2DView:
The property-based version provides more flexibility as it gives access to the full set of methods to configure the Chunk2DView. The following example shows, how we can use this approach to create a visualization that uses a black-red colormap:
Constructor & Destructor Documentation
◆ Chunk2DView() [1/2]
|
explicit |
Creates a Chunk2DView and sets its parent widget to parent. Note that you need to call show() to display the window.
The static method plot() can be used as a convenience alternative for quick visualization.
◆ Chunk2DView() [2/2]
| CTL::gui::Chunk2DView::Chunk2DView | ( | Chunk2D< float > | data, |
| QWidget * | parent = nullptr |
||
| ) |
Creates a Chunk2DView with parent widget parent and sets its data to data. Note that you need to call show() to display the window.
The static method plot() can be used as a convenience alternative for quick visualization.
Member Function Documentation
◆ autoResize
|
slot |
Requests an automatic resizing of this widget's window size. The window is tried to fit to the size of the shown data, bounded to a maximum size of 1000 x 800 pixels.
◆ contrastLine()
| QList< QPointF > CTL::gui::Chunk2DView::contrastLine | ( | ) | const |
Returns the data on the currently drawn contrast line (Right button + drag mouse).
Data is returned as a list of points containing the position on the line (ranging from 0 to 1) as x component and the corresponding data point as y. The line will be sampled with a step width of one pixel.
◆ data()
| const Chunk2D< float > & CTL::gui::Chunk2DView::data | ( | ) | const |
Returns the data held by this instance.
◆ image()
| QImage CTL::gui::Chunk2DView::image | ( | const QSize & | renderSize = QSize() | ) |
Returns the current visualization shown by this instance rendered to a QImage with size renderSize. If no size is passed, the resulting image will have the same size as the window this instance is shown in.
◆ pixmap()
| QPixmap CTL::gui::Chunk2DView::pixmap | ( | ) | const |
Returns the currently shown pixmap.
◆ plot() [1/2]
|
static |
Convenience overload to plot Chunk2D data of arbitrary template type. The values in data will be converted to float for internal storage and displaying.
◆ plot() [2/2]
|
static |
Creates a Chunk2DView for data and shows the window. If specific values are passed with windowing and/or zoom, the data windowing and zoom are set to the requested values, respectively. Otherwise, min/max windowing is applied and zoom remains at 1x.
Sensitivity of windowing using mouse gestures is adapted automatically to data (see setAutoMouseWindowScaling()).
The widget will be deleted automatically if the window is closed.
Example:
◆ save
|
slot |
Saves the image currently shown by this instance to the file fileName.
The file type must be an image file type supported by Qt and will be determined automatically from the ending of fileName. If no file type ending is found, or it is incompatible, a PNG file is created.
Same as:
◆ saveDialog
|
slot |
Opens a save file dialog to get the file name used to save the currently shown image to a file.
- See also
- save().
◆ setAutoMouseWindowScaling
|
slot |
Sets the scaling of windowing using mouse gestures to automatically determined values that are optimized for the value range in the currently managed data.
The sensitivity is adjusted such that, given a total value range in the data of [min, max], mouse gestures have the following effects:
- A vertical mouse movement of one pixel will raise/lower of the center (or level) of the current window by 1% of the total value range (ie. max - min).
- A horizontal mouse movement of one pixel will result in an decrease/increase of the window width of 1% of the total value range (ie. max - min).
◆ setColorTable()
| void CTL::gui::Chunk2DView::setColorTable | ( | const QVector< QRgb > & | colorTable | ) |
Sets the colormap of this instance to colorTable. The table must contain 256 entries.
For visualization, data managed by this instance is discretized in 256 bins within the value range specified by the current windowing settings. Each of these bins uses one color from the colormap to visualize data points falling within that bin.
Example:
◆ setContrastLinePlotLabels()
| void CTL::gui::Chunk2DView::setContrastLinePlotLabels | ( | const QString & | labelX, |
| const QString & | labelY | ||
| ) |
Sets the axis labels of contrast plots created by this instance to labelX and labelY.
◆ setData() [1/2]
| void CTL::gui::Chunk2DView::setData | ( | const Chunk2D< T > & | data | ) |
Convenience overload to set Chunk2D data of arbitrary template type. The values in data will be converted to float for internal storage and displaying.
◆ setData() [2/2]
| void CTL::gui::Chunk2DView::setData | ( | Chunk2D< float > | data | ) |
Sets the data visualized by this instance to data. Data is copied, so consider moving it if it is no longer required.
Applies a min/max windowing if no specific windowing has been set (ie. the current window is [0,0]).
◆ setLivePixelDataEnabled
|
slot |
Sets the broadcasting of live pixel data by this instance to enabled.
If enabled, a signal is emitted each time the mouse cursor moves over the image, containing the pixel coordinates and the corresponding data value under the cursor.
This signal can be catched and processed elsewhere.
◆ setMouseWindowingScaling()
| void CTL::gui::Chunk2DView::setMouseWindowingScaling | ( | double | centerScale, |
| double | widthScale | ||
| ) |
Sets the scaling of windowing using mouse gestures.
A vertical mouse movement of one pixel will raise/lower of the center (or level) of the current window by centerScale. A horizontal mouse movement of one pixel will result in an decrease/increase of the window width of widthScale.
◆ setWheelZoomPerTurn()
| void CTL::gui::Chunk2DView::setWheelZoomPerTurn | ( | double | zoomPerTurn | ) |
Sets the scaling of zooming commands using the mouse wheel (CTRL + wheel).
The current zoom factor will be increased/decreased by zoomPerTurn per 15 degree rotation of the wheel. Typically, one wheel step corresponds to 15 degrees of rotation.
◆ setWindowing
|
slot |
Sets the data windowing to show the value range [from, to] using the current colormap.
◆ setWindowingCenterWidth
|
slot |
Sets the data windowing to show a value range with a width of width centered around center using the current colormap.
In terms of start and end point, this corresponds to a window of [center - width / 2.0, center + width / 2.0].
◆ setWindowingMinMax
|
slot |
Sets the data windowing to show the entire value range (ie. minimum to maximum) occurring in the data managed by this instance.
◆ setZoom
|
slot |
Returns the zoom factor to zoom. The value 1.0 corresponds to a one-by-one visualization (ie. 100% zoom).
Zoom may not be smaller than 0.1 (ie. zoom level of 10%).
◆ showContrastLinePlot()
| void CTL::gui::Chunk2DView::showContrastLinePlot | ( | ) |
Creates (and shows) a contrast plot of the currently drawn contrast line.
Note that this requires the 'ctl_gui_charts.pri' submodule to be included to the project.
◆ windowingCenterWidth()
| QPair< double, double > CTL::gui::Chunk2DView::windowingCenterWidth | ( | ) | const |
Returns the current data windowing as a pair specifying the window center and width.
◆ windowingFromTo()
| QPair< double, double > CTL::gui::Chunk2DView::windowingFromTo | ( | ) | const |
Returns the current data windowing as a pair specifying the window start and end point.
◆ zoom()
| double CTL::gui::Chunk2DView::zoom | ( | ) | const |
Returns the current zoom factor. The value 1.0 corresponds to a one-by-one visualization (ie. 100% zoom).
The documentation for this class was generated from the following files:
- modules/src/gui/widgets/chunk2dview.h
- modules/src/gui/widgets/chunk2dview.cpp