The IntervalSeriesView class provides basic visualization of IntervalDataSeries data. More...
#include <intervalseriesview.h>

Public Member Functions | |
| IntervalSeriesView (QWidget *parent=nullptr) | |
| void | setData (const IntervalDataSeries &intervalSeries) |
 Public Member Functions inherited from CTL::gui::ChartViewBase Public Member Functions inherited from CTL::gui::ChartViewBase | |
| QImage | image (const QSize &renderSize=QSize()) |
Static Public Member Functions | |
| static void | plot (const IntervalDataSeries &intervalSeries, const QString &labelX="x", const QString &labelY="y", bool logAxisY=false) |
Private Member Functions | |
| void | copyDataToClipboard () const override |
| double | suitableLogMinVal (const IntervalDataSeries &intervalSeries) |
Static Private Attributes | |
| static constexpr auto | BAR_GAP = 0.0001 |
Additional Inherited Members | |
| Public Slots inherited from CTL::gui::ChartViewBase | |
| void | autoRange () |
| bool | save (const QString &fileName) |
| void | saveDialog () |
| void | setLabelX (const QString &label) |
| void | setLabelY (const QString &label) |
| void | setLogAxisY (bool enabled) |
| void | setOverRangeY (bool enabled) |
| void | setRangeX (double from, double to) |
| void | setRangeY (double from, double to) |
| void | setUseNiceX (bool enabled) |
| void | toggleLinLogY () |
| Protected Member Functions inherited from CTL::gui::ChartViewBase | |
| ChartViewBase (QWidget *parent=nullptr) | |
| void | mouseDoubleClickEvent (QMouseEvent *event) override |
| void | keyPressEvent (QKeyEvent *event) override |
| void | mySetAxisX (QAbstractAxis *axisX, QAbstractSeries *series) |
| void | mySetAxisY (QAbstractAxis *axisY, QAbstractSeries *series) |
| QAbstractAxis * | myAxisX (QAbstractSeries *series) |
| QAbstractAxis * | myAxisY (QAbstractSeries *series) |
| void | setSeriesShow (QAbstractSeries *series, bool shown) |
| void | switchToLinAxisY () |
| void | switchToLogAxisY () |
| bool | yAxisIsLinear () const |
| Protected Attributes inherited from CTL::gui::ChartViewBase | |
| QChart * | _chart |
| QAbstractSeries * | _plottableSeries |
| QAbstractSeries * | _plottableSeriesLog |
| QLineSeries * | _dataSeries |
| QLineSeries * | _dataSeriesLog |
Detailed Description
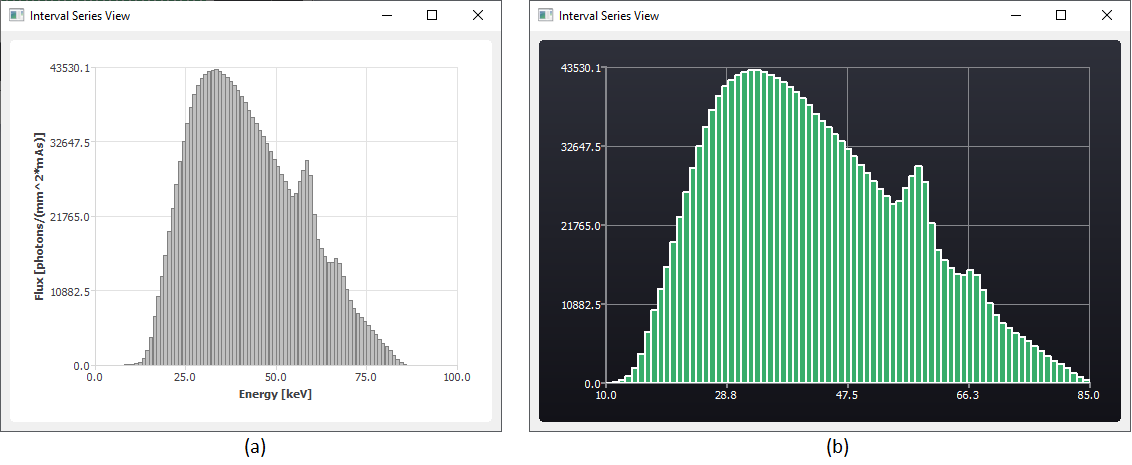
The IntervalSeriesView class provides basic visualization of IntervalDataSeries data.
This class can be used to visualize data stored in an IntervalDataSeries. For convenience, the plot() method can be used to achieve a one-line solution, creating a widget that will be destroyed once it is closed by the user.
Data will be visualized as a bar plot. Each bar represents the bin integral value stored in the corresponding bin of the IntervalDataSeries that is visualized. Axis labels can be specified using setLabelX() and setLabelY() or by passing the labels as arguments when using the plot() method, respectively. Logarithmic y-axis visualization can be enabled using setLogAxisY(true), or by passing the corresponding flag as last argument of plot().
The following IO operations are supported by this class:
- Zooming:
- Hold left mouse button + drag rectangle to zoom into that particular section of the plot.
- Right click to zoom out.
- Double-click left to request automatic zooming (ie. min/max).
- Copying data to clipboard:
- Press CTRL + C to copy the values in the current plot to the clipboard. Each data point will be on a separate line with x and y value separated by a single whitespace.
- Save to image:
- Press CTRL + S to open a dialog for saving the current figure to a file.
Axis ranges (both x and y) can also be defined explicitely using setRangeX() and setRangeY().
The following example shows how to visualize data sampled from a data model:
Constructor & Destructor Documentation
◆ IntervalSeriesView()
|
explicit |
Creates an IntervalSeriesView and sets its parent to parent.
By default, this class uses "Y axis over ranging" (see setOverRangeY()).
Member Function Documentation
◆ plot()
|
static |
Creates an IntervalSeriesView for intervalSeries and shows the window.
Labels of the axes can be specified by labelX and labelY. If left empty, default axis labels are "x" and "y". To create a plot with a logarithmic y-axis, pass true for logAxisY.
The widget will be deleted automatically if the window is closed.
Example: visualize spectrum of an X-ray tube with 120 keV tube voltage

◆ setData()
| void CTL::gui::IntervalSeriesView::setData | ( | const IntervalDataSeries & | intervalSeries | ) |
Sets the series visualized by this instance to intervalSeries.
Applies a min/max range (see autoRange()). By default, this class uses "Y axis over ranging" (see setOverRangeY()).
◆ suitableLogMinVal()
|
private |
Finds a suitable lower end point for the bars in logarithmic scale plot mode. This returns a value of 0.01 times the smallest positive value occuring in intervalSeries (bound to a minimum value of std::numeric_limits<double>::min()).
This leads to a visualization in which the lower end of all bars is two decades below the minimal occuring upper end of all bars.
The documentation for this class was generated from the following files:
- modules/src/gui/widgets/intervalseriesview.h
- modules/src/gui/widgets/intervalseriesview.cpp