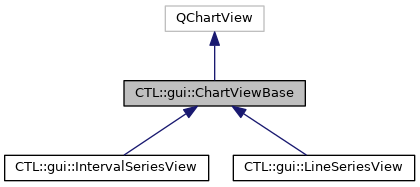
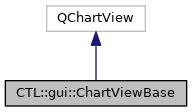
The ChartViewBase class is the base class for plot-like visualizers in the CTL.
More...
#include <chartviewbase.h>
|
| QImage | image (const QSize &renderSize=QSize()) |
| |
|
| | ChartViewBase (QWidget *parent=nullptr) |
| |
|
void | mouseDoubleClickEvent (QMouseEvent *event) override |
| |
|
void | keyPressEvent (QKeyEvent *event) override |
| |
|
virtual void | copyDataToClipboard () const |
| |
|
void | mySetAxisX (QAbstractAxis *axisX, QAbstractSeries *series) |
| |
|
void | mySetAxisY (QAbstractAxis *axisY, QAbstractSeries *series) |
| |
|
QAbstractAxis * | myAxisX (QAbstractSeries *series) |
| |
|
QAbstractAxis * | myAxisY (QAbstractSeries *series) |
| |
|
void | setSeriesShow (QAbstractSeries *series, bool shown) |
| |
|
void | switchToLinAxisY () |
| |
|
void | switchToLogAxisY () |
| |
|
bool | yAxisIsLinear () const |
| |
|
|
QChart * | _chart |
| |
|
QAbstractSeries * | _plottableSeries |
| |
|
QAbstractSeries * | _plottableSeriesLog |
| |
|
QLineSeries * | _dataSeries |
| |
|
QLineSeries * | _dataSeriesLog |
| |
|
|
bool | _overRangeY = false |
| |
|
bool | _useNiceX = false |
| |
The ChartViewBase class is the base class for plot-like visualizers in the CTL.
This class is used as base class for LineSeriesView and IntervalSeriesView. Refer to the corresponding documentations of these classes for details on usage.
◆ ChartViewBase()
| CTL::gui::ChartViewBase::ChartViewBase |
( |
QWidget * |
parent = nullptr | ) |
|
|
explicitprotected |
◆ autoRange
| void CTL::gui::ChartViewBase::autoRange |
( |
| ) |
|
|
slot |
Automatically sets the data range visualized by this instance to the minimum and maximum values (on both axes) occurring in the data managed by this instance.
If such a range would be of length zero, i.e. minimum and maximum value are identical, the range will be chosen as [value - 1.0, value + 1.0].
Note that if setOverRangeY() or setUseNiceX() have been used to activate the corresponding range adjust mechanism, determined min/max values are adjusted accordingly.
◆ image()
| QImage CTL::gui::ChartViewBase::image |
( |
const QSize & |
renderSize = QSize() | ) |
|
Returns the current visualization shown by this instance rendered to a QImage with size renderSize. If no size is passed, the resulting image will have the same size as the window this instance is shown in.
◆ save
| bool CTL::gui::ChartViewBase::save |
( |
const QString & |
fileName | ) |
|
|
slot |
Saves the image currently shown by this instance to the file fileName.
The file type must be an image file type supported by Qt and will be determined automatically from the ending of fileName. If no file type ending is found, or it is incompatible, a PNG file is created.
Same as:
◆ saveDialog
| void CTL::gui::ChartViewBase::saveDialog |
( |
| ) |
|
|
slot |
Opens a save file dialog to get the file name used to save the currently shown image to a file.
- See also
- save().
◆ setLabelX
| void CTL::gui::ChartViewBase::setLabelX |
( |
const QString & |
label | ) |
|
|
slot |
Sets the label text on the x-axis to label.
◆ setLabelY
| void CTL::gui::ChartViewBase::setLabelY |
( |
const QString & |
label | ) |
|
|
slot |
Sets the label text on the y-axis to label.
◆ setLogAxisY
| void CTL::gui::ChartViewBase::setLogAxisY |
( |
bool |
enabled | ) |
|
|
slot |
Puts the y-axis of this instance to logarithmic mode if enabled = true and in linear mode otherwise.
◆ setOverRangeY
| void CTL::gui::ChartViewBase::setOverRangeY |
( |
bool |
enabled | ) |
|
|
slot |
Sets the usage of the y-axis over ranging to enabled.
If in use, display ranges for the y-axis are always modified to extend their upper end point. Ranges are adjusted such that the end point is increased by 1% of the total width of the requested range. This can be helpful to avoid unpleasant appearances of data points on the very (upper) end of the plot range.
When activated, this is also used when automatic ranging is performed (see also autoRange()).
◆ setRangeX
| void CTL::gui::ChartViewBase::setRangeX |
( |
double |
from, |
|
|
double |
to |
|
) |
| |
|
slot |
Sets the range of the x-axis to [from, to].
Note that this range might be adjusted if "Nice X mode" is enabled (see setUseNiceX()).
◆ setRangeY
| void CTL::gui::ChartViewBase::setRangeY |
( |
double |
from, |
|
|
double |
to |
|
) |
| |
|
slot |
Sets the range of the y-axis to [from, to].
Note that the upper end (ie. to) of the range is adjusted if "*y*-axis over ranging" is enabled (see setOverRangeY()).
◆ setUseNiceX
| void CTL::gui::ChartViewBase::setUseNiceX |
( |
bool |
enabled | ) |
|
|
slot |
Sets the usage of the "Nice X mode" to enabled. If activated, this uses QtCharts::QValueAxis::applyNiceNumbers() to adjust the range of the x-axis.
◆ toggleLinLogY
| void CTL::gui::ChartViewBase::toggleLinLogY |
( |
| ) |
|
|
slot |
Switches between the linear and logarithmic mode of the y-axis.
The documentation for this class was generated from the following files:
- modules/src/gui/widgets/chartviewbase.h
- modules/src/gui/widgets/chartviewbase.cpp