The LineSeriesView class provides basic visualization of XYDataSeries data. More...
#include <lineseriesview.h>

Public Slots | |
| void | setShowPoints (bool enabled=true) |
 Public Slots inherited from CTL::gui::ChartViewBase Public Slots inherited from CTL::gui::ChartViewBase | |
| void | autoRange () |
| bool | save (const QString &fileName) |
| void | saveDialog () |
| void | setLabelX (const QString &label) |
| void | setLabelY (const QString &label) |
| void | setLogAxisY (bool enabled) |
| void | setOverRangeY (bool enabled) |
| void | setRangeX (double from, double to) |
| void | setRangeY (double from, double to) |
| void | setUseNiceX (bool enabled) |
| void | toggleLinLogY () |
Public Member Functions | |
| LineSeriesView (QWidget *parent=nullptr) | |
| void | setData (const PointSeriesBase &lineSeries) |
| void | setData (const QList< QPointF > &lineSeries) |
| Public Member Functions inherited from CTL::gui::ChartViewBase | |
| QImage | image (const QSize &renderSize=QSize()) |
Static Public Member Functions | |
| static void | plot (const PointSeriesBase &lineSeries, const QString &labelX="x", const QString &labelY="y", bool logAxisY=false) |
| static void | plot (const QList< QPointF > &lineSeries, const QString &labelX="x", const QString &labelY="y", bool logAxisY=false) |
Additional Inherited Members | |
| Protected Member Functions inherited from CTL::gui::ChartViewBase | |
| ChartViewBase (QWidget *parent=nullptr) | |
| void | mouseDoubleClickEvent (QMouseEvent *event) override |
| void | keyPressEvent (QKeyEvent *event) override |
| virtual void | copyDataToClipboard () const |
| void | mySetAxisX (QAbstractAxis *axisX, QAbstractSeries *series) |
| void | mySetAxisY (QAbstractAxis *axisY, QAbstractSeries *series) |
| QAbstractAxis * | myAxisX (QAbstractSeries *series) |
| QAbstractAxis * | myAxisY (QAbstractSeries *series) |
| void | setSeriesShow (QAbstractSeries *series, bool shown) |
| void | switchToLinAxisY () |
| void | switchToLogAxisY () |
| bool | yAxisIsLinear () const |
| Protected Attributes inherited from CTL::gui::ChartViewBase | |
| QChart * | _chart |
| QAbstractSeries * | _plottableSeries |
| QAbstractSeries * | _plottableSeriesLog |
| QLineSeries * | _dataSeries |
| QLineSeries * | _dataSeriesLog |
Detailed Description
The LineSeriesView class provides basic visualization of XYDataSeries data.
This class can be used to visualize data stored in an XYDataSeries. For convenience, the plot() method can be used to achieve a one-line solution, creating a widget that will be destroyed once it is closed by the user.
Data will be visualized as a line plot. Individual data points are not shown by default. Use setShowPoints() to enable this. Axis labels can be specified using setLabelX() and setLabelY() or by passing the labels as arguments when using the plot() method, respectively. Logarithmic y-axis visualization can be enabled using setLogAxisY(true), or by passing the corresponding flag as last argument of plot().
The following IO operations are supported by this class:
- Zooming:
- Hold left mouse button + drag rectangle to zoom into that particular section of the plot.
- Right click to zoom out.
- Double-click left to request automatic zooming (ie. min/max).
- Copying data to clipboard:
- Press CTRL + C to copy the values in the current plot to the clipboard. Each data point will be on a separate line with x and y value separated by a single whitespace.
- Save to image:
- Press CTRL + S to open a dialog for saving the current figure to a file.
Axis ranges (both x and y) can also be defined explicitely using setRangeX() and setRangeY().
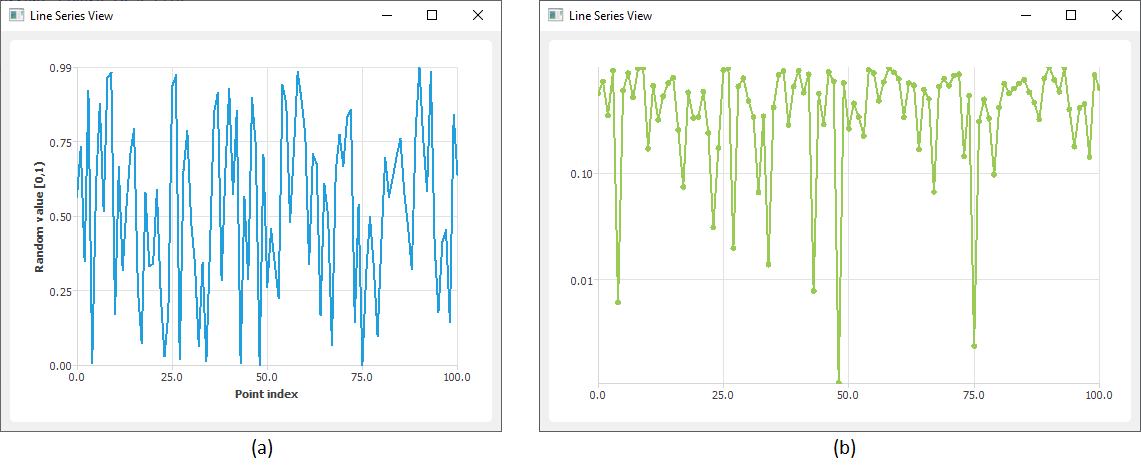
The following example shows how to visualize some random data points using LineSeriesView:
Constructor & Destructor Documentation
◆ LineSeriesView()
|
explicit |
Creates a LineSeriesView and sets its parent to parent.
Member Function Documentation
◆ plot() [1/2]
|
static |
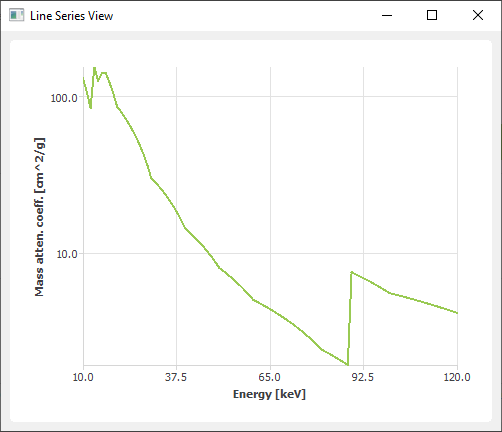
Creates a LineSeriesView for lineSeries and shows the window.
Labels of the axes can be specified by labelX and labelY. If left empty, default axis labels are "x" and "y". To create a plot with a logarithmic y-axis, pass true for logAxisY.
The widget will be deleted automatically if the window is closed.
Example:
◆ plot() [2/2]
|
static |
Convenience overload. See plot(const XYDataSeries&, const QString&, const QString&, bool).
◆ setData() [1/2]
| void CTL::gui::LineSeriesView::setData | ( | const PointSeriesBase & | lineSeries | ) |
Sets the series visualized by this instance to lineSeries.
Applies a min/max range (see autoRange()).
◆ setData() [2/2]
| void CTL::gui::LineSeriesView::setData | ( | const QList< QPointF > & | lineSeries | ) |
Convenience overload of setData(const XYDataSeries&).
◆ setShowPoints
|
slot |
Sets the visibility of markers for data points to enabled. Markers are not shown by default.
The documentation for this class was generated from the following files:
- modules/src/gui/widgets/lineseriesview.h
- modules/src/gui/widgets/lineseriesview.cpp